
US Aquaculture Statistics by State: Farms and Sales (2023 Census)
Fish and shellfish farming in the US is concentrated in a few states, and each leans on a different crop. These aquaculture statistics by state come from USDA’s 2023 Census of Aquaculture, plus newer 2026 catfish and trout reports.
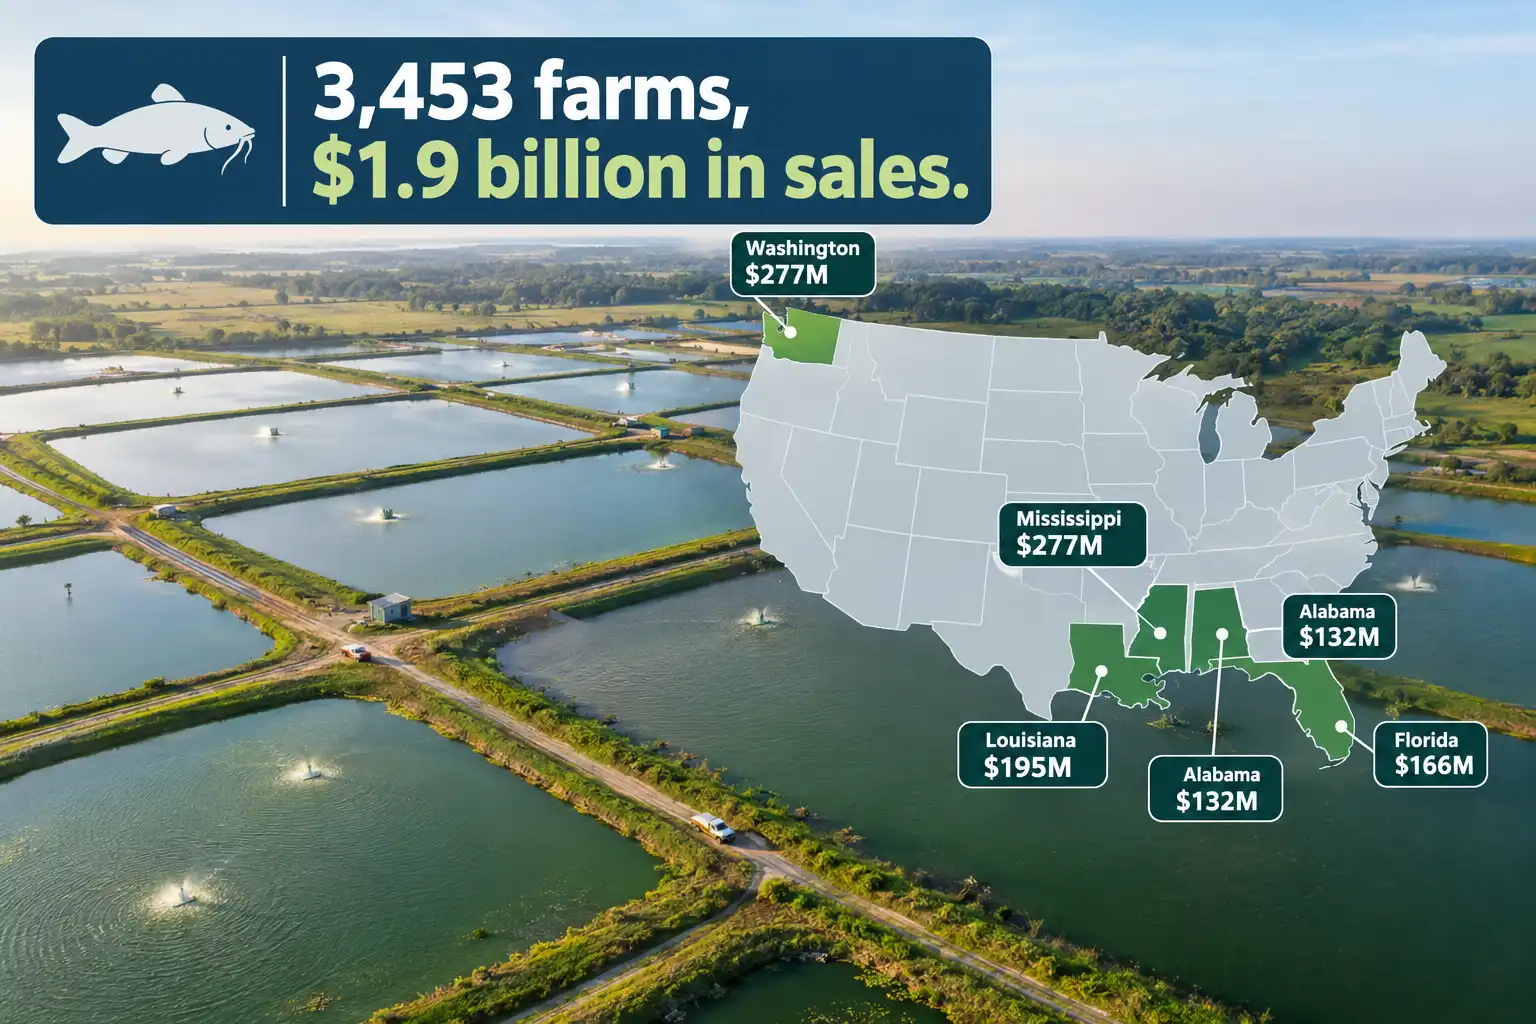
Mississippi led 2023 aquaculture sales at $277.0 million, just ahead of Washington, per USDA’s latest aquaculture statistics by state. Louisiana had the most farms, 818 of 3,453. National farm-gate sales reached $1.9 billion.
US Aquaculture at a Glance: 2023 Census Totals
The US had 3,453 aquaculture farms with sales in 2023, up 18 percent from 2,932 in 2018. Their farm-gate sales totaled $1.908 billion, up 26 percent from $1.516 billion. Those figures come from USDA NASS’s 2023 Census of Aquaculture highlights, released in December 2024. The average farm sold $552,569 worth of product.
Growth looks smaller after inflation. The USDA Economic Research Service puts the real gain at 3.8 percent since 2018. Even so, ERS notes that farm numbers and sales rose together for the first time in 25 years.
Sales are also concentrated. Five states (Mississippi, Washington, Louisiana, Florida, and Alabama) held 55 percent of sales and 49 percent of farms. Meanwhile, the 11 states with $50 million or more in sales made up over four-fifths of the national total.
So a handful of states, and a handful of crops, shape the national numbers. Catfish and oysters were the two top-selling species.
Aquaculture Statistics by State: Top 15 Farms and Sales
Mississippi and Washington finished almost level in 2023, just $60,000 apart. The table below ranks the 15 states with the highest published sales, taken from Table 1 of the 2023 census.
| Rank | State | Farms (2023) | Sales 2023 ($ million) | Sales 2018 ($ million) | Change in sales |
|---|---|---|---|---|---|
| 1 | Mississippi | 129 | 277.0 | 215.7 | +28% |
| 2 | Washington | 162 | 276.9 | 207.7 | +33% |
| 3 | Louisiana | 818 | 195.2 | 135.7 | +44% |
| 4 | Florida | 488 | 165.9 | 71.6 | +132% |
| 5 | Alabama | 102 | 131.9 | 95.2 | +39% |
| 6 | California | 79 | 119.0 | 106.0 | +12% |
| 7 | Virginia | 146 | 104.2 | 112.6 | -7% |
| 8 | Arkansas | 55 | 84.2 | 67.7 | +24% |
| 9 | Maine | 113 | 70.8 | 72.3 | -2% |
| 10 | Hawaii | 47 | 65.2 | 78.4 | -17% |
| 11 | Texas | 75 | 53.9 | 62.6 | -14% |
| 12 | Idaho | 17 | 41.2 | 44.8 | -8% |
| 13 | Massachusetts | 204 | 35.9 | 28.9 | +24% |
| 14 | North Carolina | 95 | 33.2 | 26.0 | +28% |
| 15 | Oregon | 37 | 26.3 | 23.7 | +11% |
Together, these 15 states made up about 88 percent of US aquaculture sales. Florida posted the biggest jump, more than doubling its 2018 total. By contrast, Virginia, Maine, Hawaii, Texas, and Idaho all sold less than in 2018.
Three states have withheld totals: Georgia, New Mexico, and Wyoming. Nevada and North Dakota reported no aquaculture sales at all.
What the Top Five States Farm
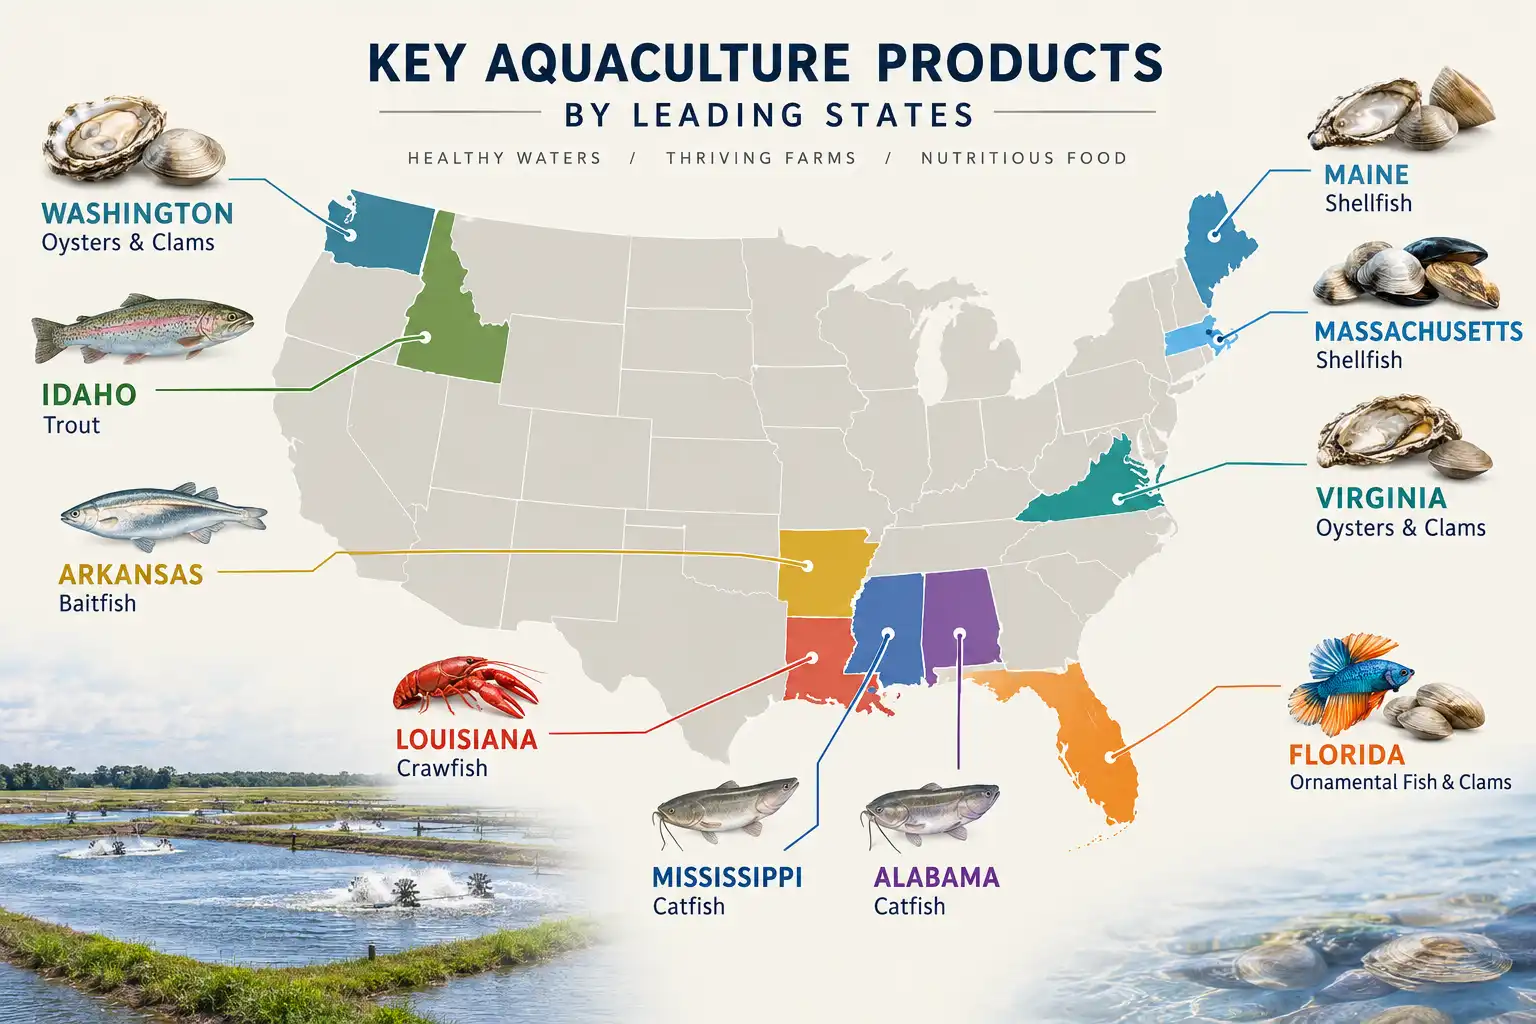
Each leading state rests on one or two crops. Table 1 of the census splits each state’s sales by product type, which shows where the money comes from.
Mississippi: Catfish
Of Mississippi’s 129 farms, 122 sold food fish. Pond-raised catfish are the main crop: the census counted 398 catfish farms nationwide, and 30 percent were in Mississippi.
Washington: Oysters and Clams
Washington sold $242.8 million of mollusks from 147 farms, about 88 percent of its total. Nationally, oysters and clams made up 96 percent of mollusk sales.
Louisiana: Crawfish
Louisiana had 818 farms, about 24 percent of the US total, per USDA ERS. Crustacean sales there reached $122.5 million from 731 farms. In fact, 97 percent of the 751 US farms raising crawfish were in Louisiana.
Florida: Ornamental Fish and Clams
Florida ranked second in farms but fourth in sales. Ornamental fish led at $57.8 million from 161 farms. Mollusks added $43.3 million, and UF/IFAS Extension reports 111 Florida growers sold $32.0 million of clams, second in the nation.
Alabama: Catfish
Alabama sold $126.9 million of food fish, 96 percent of its $131.9 million total. Like Mississippi, Alabama is a catfish state.
States Six to Fifteen: Smaller Totals, Different Crops
Below the top five, the product mix changes from state to state. These splits come from the same census table, with 2023 sales:
- California ($119.0 million): food fish $47.8 million, mollusks $35.6 million, and miscellaneous products $20.9 million
- Virginia ($104.2 million): mollusks $87.1 million from 119 farms, 84 percent of state sales
- Arkansas ($84.2 million): food fish $39.4 million and baitfish $27.4 million, more than half of US baitfish sales
- Maine ($70.8 million): 86 of 113 farms grow mollusks, and Maine holds 29 percent of the 63 US farms growing algae; the product split is withheld
- Hawaii ($65.2 million): crustaceans $23.0 million from 11 farms and food fish $9.2 million
- Texas ($53.9 million): food fish $42.8 million from 51 farms
- Idaho ($41.2 million): all 17 farms sell food fish, but the value is withheld
- Massachusetts ($35.9 million): 200 of 204 farms grow mollusks
Idaho is the trout state. NASS’s Trout Production report for February 2026 puts Idaho trout sales at $43.5 million in 2025. That is about 43 percent of all US trout sales.
Massachusetts, meanwhile, holds 21 percent of US oyster farms, the largest share of any state. However, most of them are small, as the next section shows.
Why Farm Counts and Sales Rankings Don’t Match
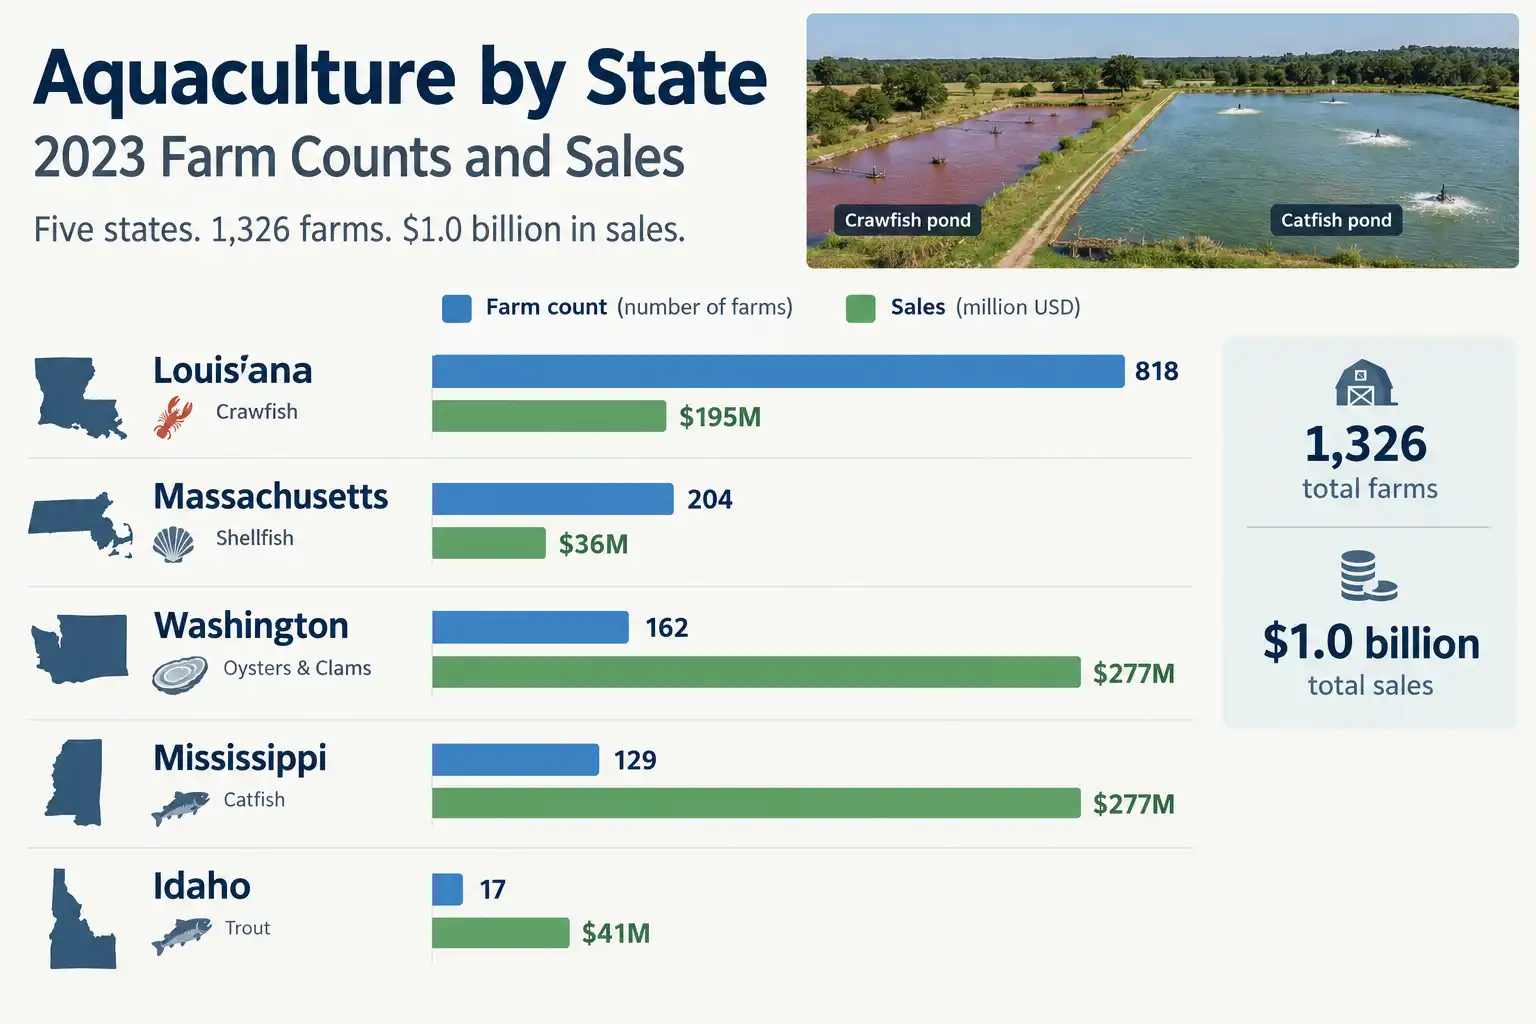
Farm size varies by crop, so the state with the most farms isn’t the state with the most sales. USDA ERS points out that Mississippi ranked first in sales but only sixth in farm numbers.
Average sales per farm shows the gap. The formula is simple:
Average sales per farm = state sales / number of farms
- Idaho: $41.2 million / 17 farms = about $2.42 million per farm
- Mississippi: $277.0 million / 129 farms = about $2.15 million per farm
- Washington: $276.9 million / 162 farms = about $1.71 million per farm
- Louisiana: $195.2 million / 818 farms = about $239,000 per farm
- Massachusetts: $35.9 million / 204 farms = about $176,000 per farm
The national average was $552,569. So an average Louisiana farm sells about one-ninth as much as an average Mississippi farm.
The trend runs in different directions, too. Mississippi lost 45 farms between 2018 and 2023, yet its sales rose 28 percent. As a result, its average sales per farm climbed from about $1.24 million to $2.15 million. Louisiana went the other way, adding 296 farms.
Run the same math for your own state with Table 1. Then compare your result with the national average. A figure well above it points to a few large farms, while a lower one points to many small ones.
US Aquaculture Sales by Product Type
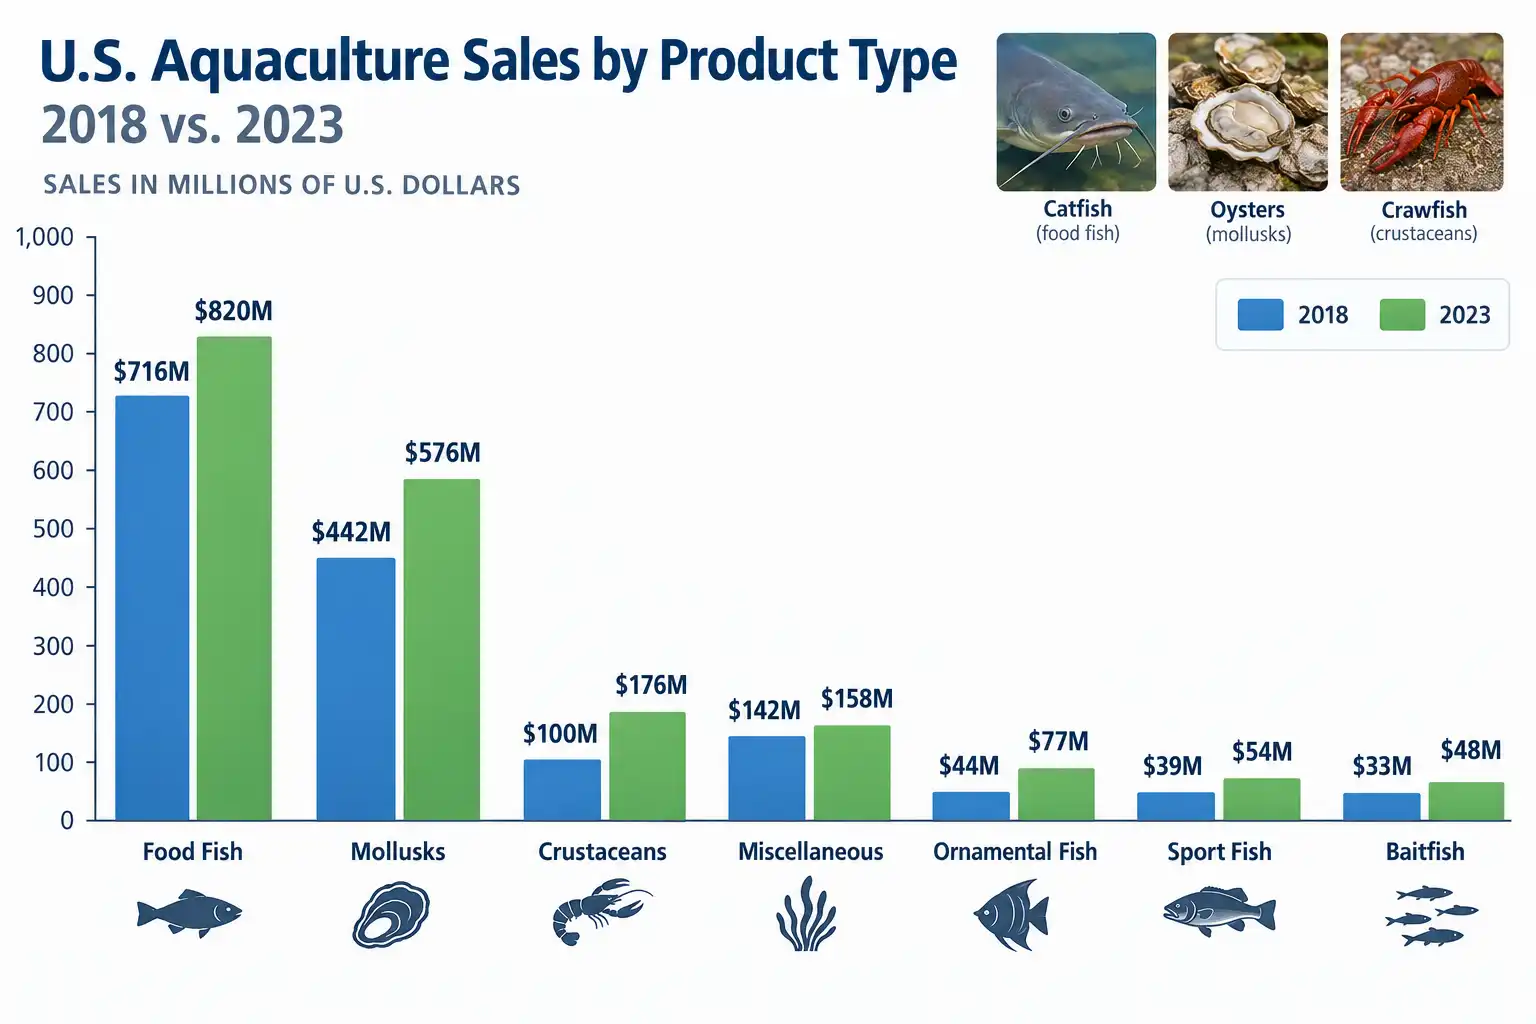
Food fish led 2023 sales, and every product type grew from 2018. The census highlights report these totals:
| Product type | Farms (2023) | Sales 2018 ($ million) | Sales 2023 ($ million) | Change |
|---|---|---|---|---|
| Food fish | 968 | 716.0 | 819.6 | +14% |
| Mollusks | 1,140 | 441.8 | 575.5 | +30% |
| Crustaceans | 848 | 100.4 | 175.7 | +75% |
| Miscellaneous | 238 | 141.9 | 157.7 | +11% |
| Ornamental fish | 315 | 43.5 | 77.1 | +77% |
| Sport fish | 249 | 39.4 | 54.4 | +38% |
| Baitfish | 205 | 32.8 | 48.1 | +47% |
Farms can sell more than one product type, so the farm counts add up to more than 3,453.
Within each group, one or two species carry most of the sales:
| Species | 2023 sales ($ million) | Share of its product group |
|---|---|---|
| Catfish | 480.0 | 59% of food fish |
| Oysters | 327.0 | 57% of mollusks |
| Clams | 222.2 | 39% of mollusks |
| Trout | 134.1 | 16% of food fish |
| Crawfish (for food) | 122.8 | 70% of crustaceans |
| Alligators | 95.0 | 60% of miscellaneous |
| Saltwater shrimp | 51.1 | 29% of crustaceans |
Mollusks also had the most farms of any product type. In fact, oysters were raised on 900 farms, more than any other species the census highlights. That helps explain the high farm counts in shellfish states such as Massachusetts and Virginia.
How the Census Counts Farms and Sales
A place counts as a farm if it sold at least $1,000 of aquaculture products in the census year. Products distributed for conservation, enhancement, or recreation count too, according to NASS’s Census of Aquaculture page. Wild-caught fish and shellfish from public waters are not counted. Response is required by law, and NASS publishes only totals.
Keep four limits in mind when you read the tables:
- Sales are first-sale value. For food fish, 69 percent of sales went to processors. So the figures reflect farm prices, not retail prices.
- Sales are not profit. The census reports receipts, not feed, labor, or power costs.
- “(D)” means withheld. NASS hides a figure when publishing it would reveal an individual farm’s data. That is why Georgia’s total and Mississippi’s food fish sales are blank.
- Stocking fish count separately. In 2023, 380 farms distributed 134.7 million trout for conservation or recreation. Counting those farms, 4,052 operations sold or distributed aquaculture products.
Because processors bought most food fish, lining up buyers before you stock deserves as much attention as the production plan.
The census runs every five years, and the 2023 edition was NASS’s fourth national aquaculture census. Its figures remain the latest complete farm and sales count by state.
Newer State Figures for Catfish and Trout
NASS updates catfish and trout between censuses, so you can check those two species against 2025 and 2026 numbers.
Catfish. The February 2026 Catfish Production report puts 2025 US catfish sales at $393.8 million, up 1 percent. Mississippi, Alabama, Arkansas, and Texas made up 96 percent:
| State | 2025 catfish sales ($ million) | Water acres, Jan. to June 2026 |
|---|---|---|
| Mississippi | 233.3 | 28,500 |
| Alabama | 99.5 | 10,300 |
| Arkansas | 25.1 | 3,200 |
| Texas | 19.3 | 1,600 |
| United States | 393.8 | 48,115 |
US catfish water acres fell 8 percent from a year earlier. Later, the July 2026 report showed stockers in Alabama, Arkansas, and Mississippi down 16 percent on July 1. Food-size inventory there held almost level.
Trout. US trout sales fell 6 percent to $102.0 million in 2025, per the February 2026 Trout Production report. Among states with published figures, Pennsylvania ($8.3 million) and North Carolina ($7.6 million) trailed Idaho by a wide margin.
These reports use different survey methods from the census. So compare each one with its own earlier editions, not with census totals.
FAQs About US Aquaculture by State
Which state has the most aquaculture farms?
Louisiana has the most, with 818 farms in 2023, about 24 percent of the US total. Most raise crawfish, so Louisiana ranks third in sales despite leading the country in farm numbers.
Which state has the highest aquaculture sales?
Mississippi led 2023 sales at $276.95 million, with catfish as its main crop. Washington was a close second at $276.89 million, mostly from shellfish, so only about $60,000 separated them.
How much is the US aquaculture industry worth?
US farms sold $1.908 billion of aquaculture products in 2023, per USDA NASS. That is farm-gate value, up 26 percent from 2018, or 3.8 percent after inflation, according to USDA ERS.
What is the most valuable farmed species in the US?
Catfish is the most valuable, with $480.0 million in 2023 sales and 59 percent of food fish sales. Oysters ranked second at $327.0 million, followed by clams at $222.2 million.
Why is my state’s aquaculture data marked (D)?
A “(D)” means NASS withheld the figure to avoid revealing data for individual farms. It appears when only a few operations produce something in a state, such as Georgia’s 2023 sales total.
How often does USDA update aquaculture statistics?
The full Census of Aquaculture runs every five years, and the 2023 edition is the latest. Between censuses, NASS publishes Catfish Production each February and July and Trout Production each February.
Putting These Numbers to Work
Start with your own state’s row in Table 1. Look at which product type leads, how many farms share the market, and the average sales per farm. For example, many small oyster or crawfish farms make a different market than a few large catfish farms.
Then check the rules before you plan around any species. State licenses and species lists vary, so review aquaculture permits and licenses for your state early. If the numbers point you toward a start, the steps for setting up a fish or shellfish farm come next.